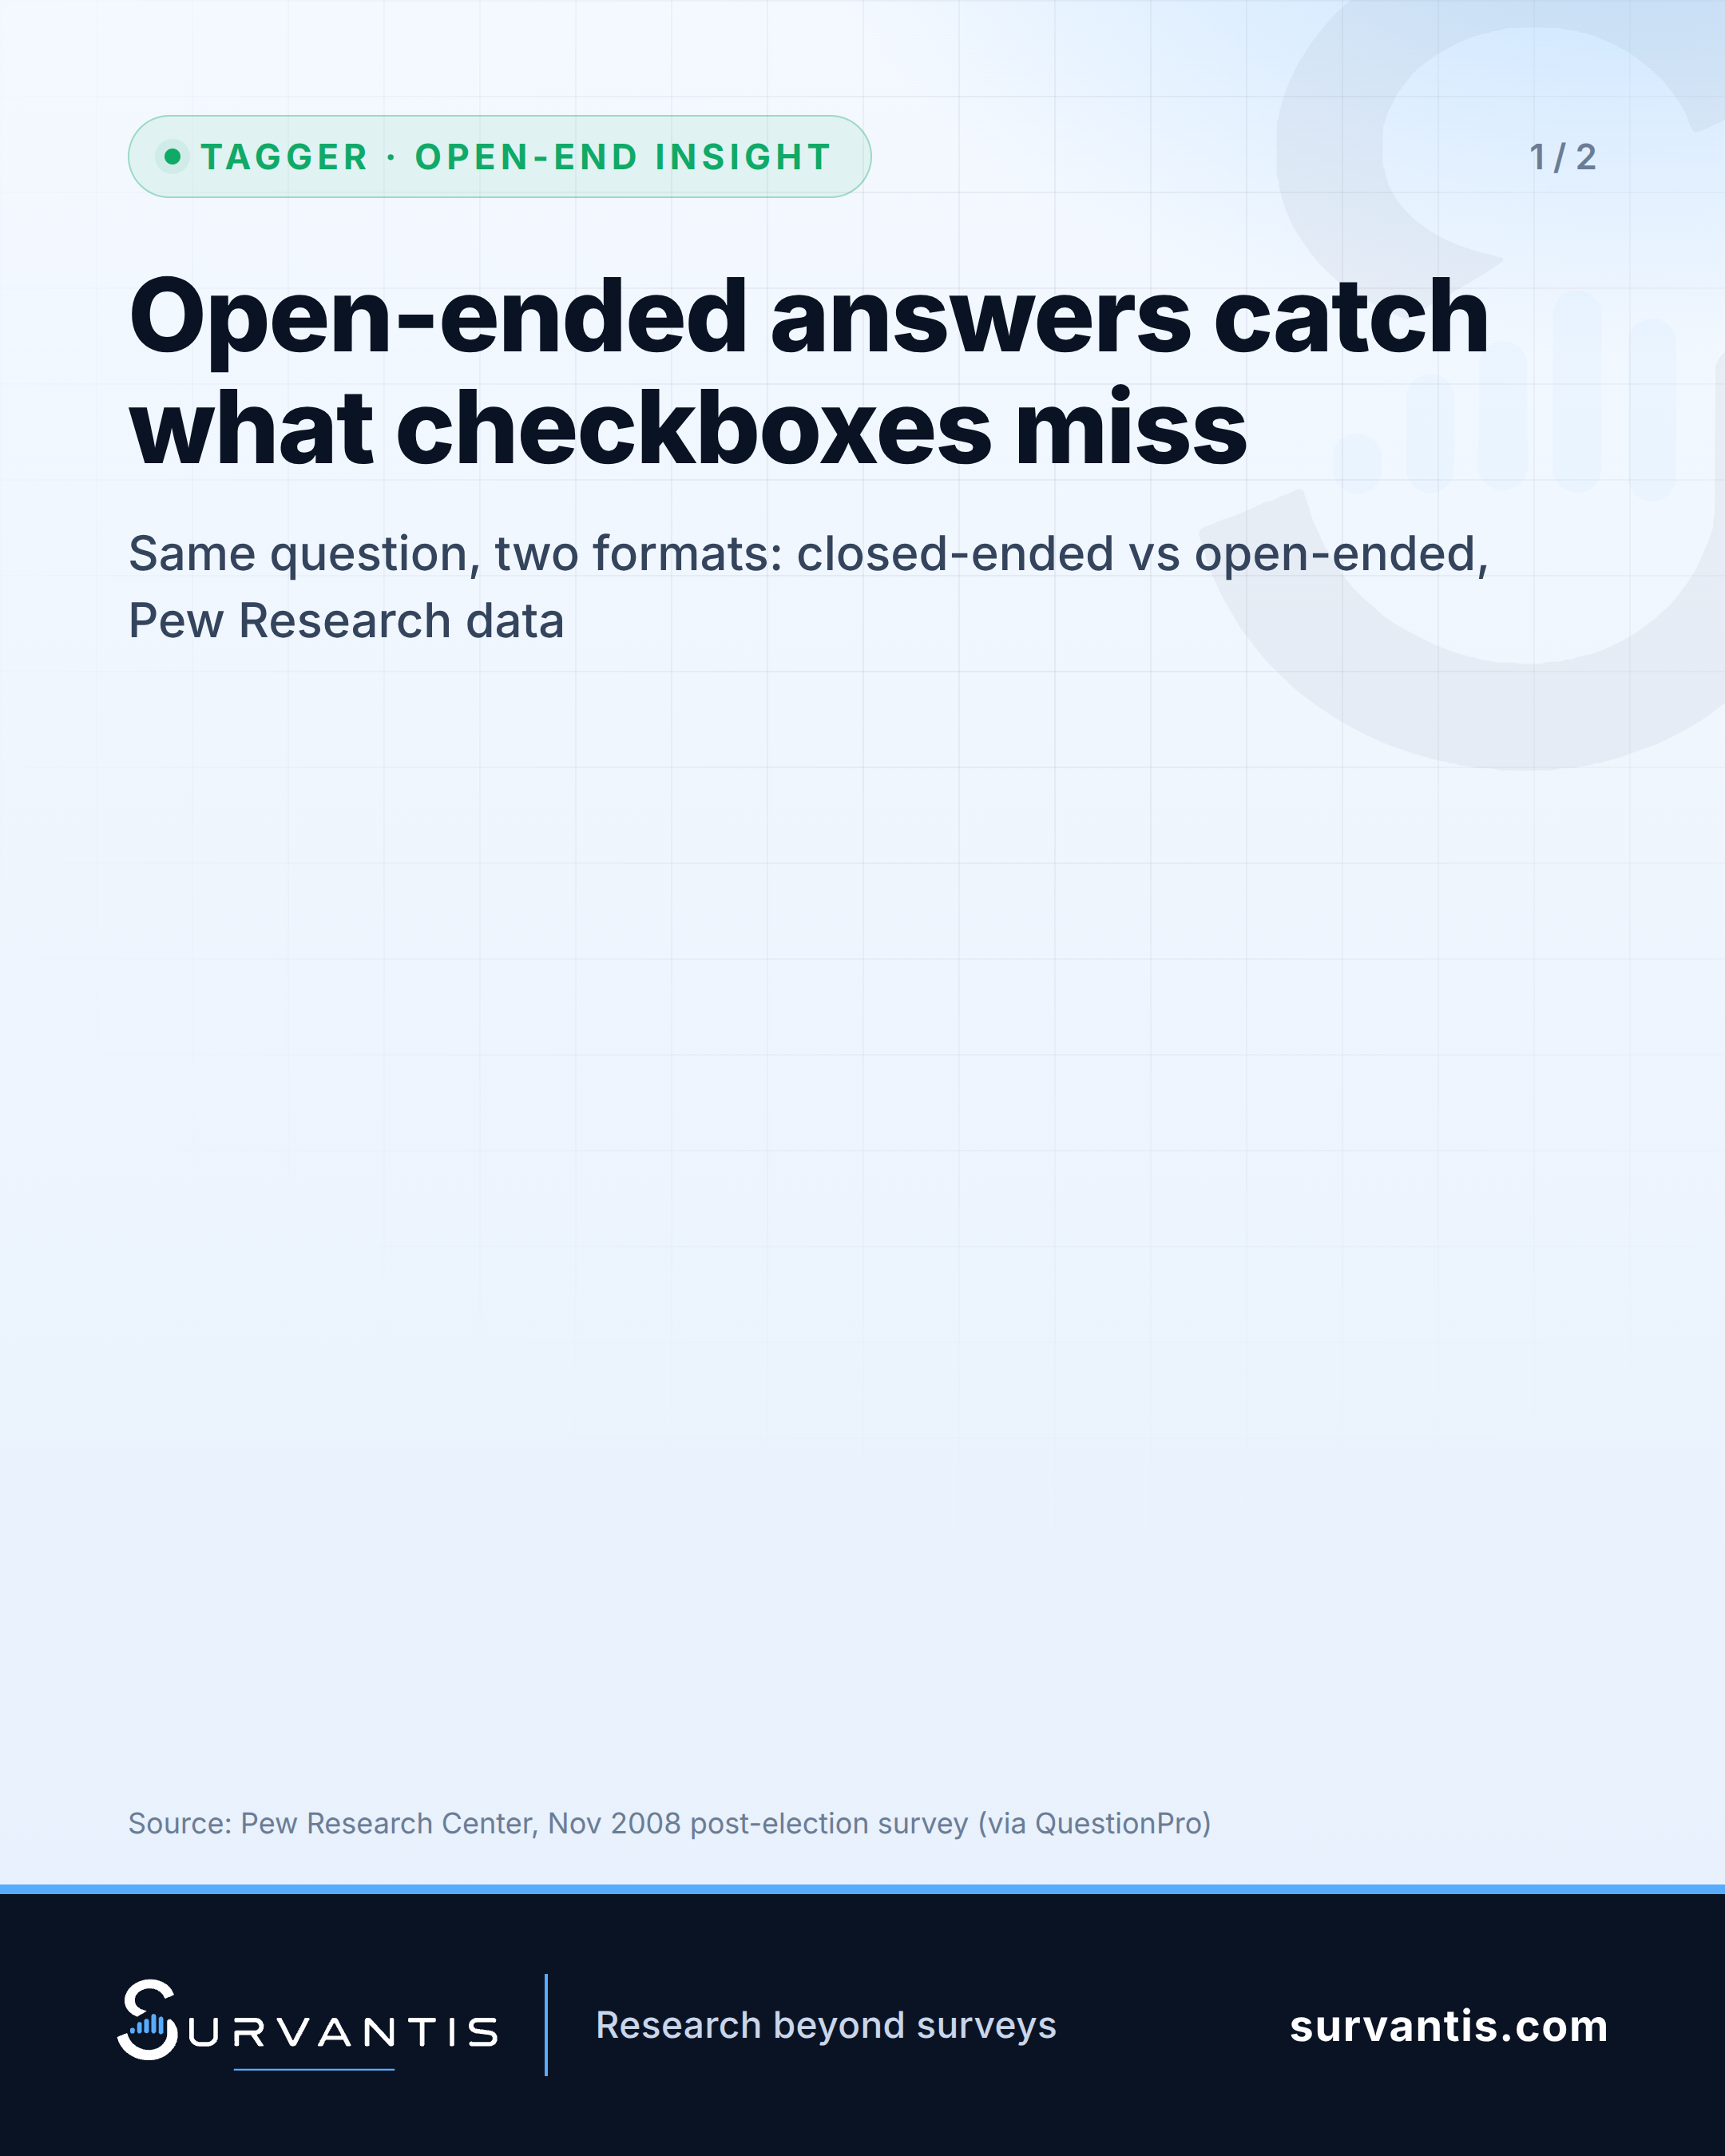
That gap is the whole case for open-ended questions — and the whole headache of analyzing them. People say more, and messier things, when you don't hand them a list.
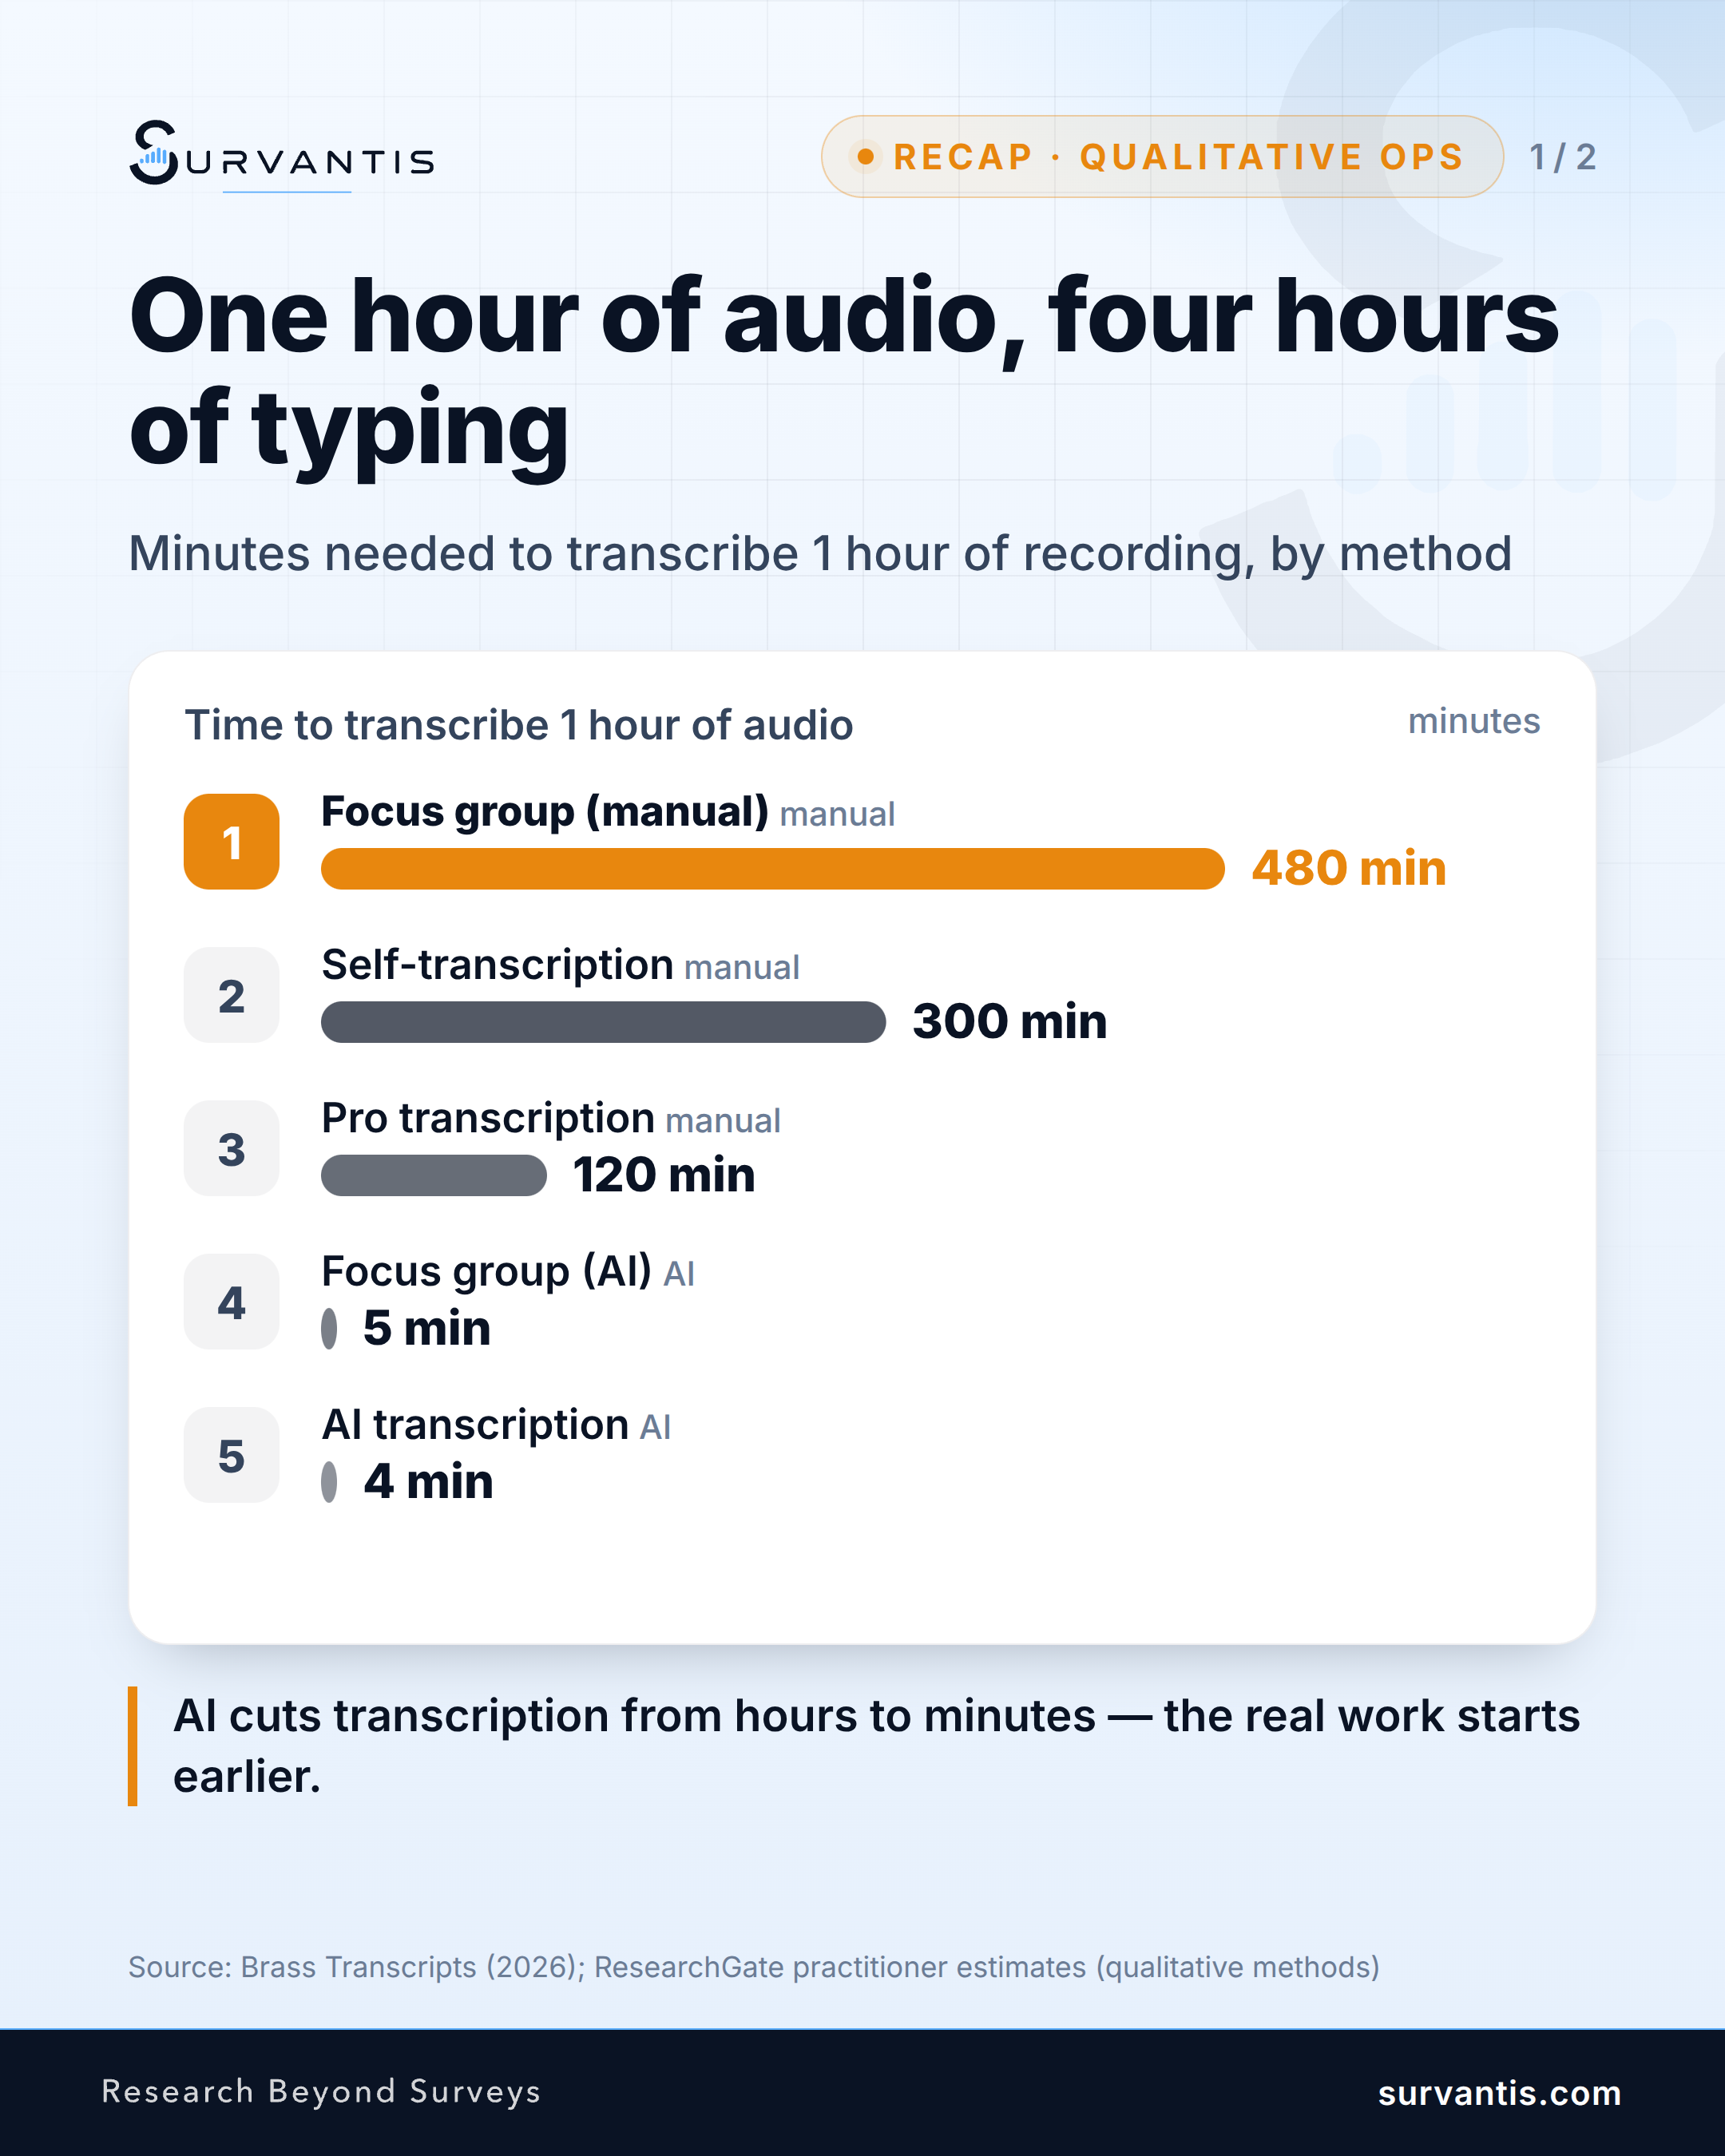
The cost shows up downstream. Item nonresponse on open-ends runs around 18% on average, nearly ten times the rate for closed questions. And once the answers do come in, someone has to read them. Manual coding typically takes 2–5 minutes per response, which on a study with a few thousand verbatims turns into 30–50% of total project time, by far the biggest bottleneck between fieldwork and the report.
Most teams know the fix in theory: build a codeframe early, keep the “uncategorized” bucket under 10%, don't let one tired analyst code 2,000 rows on a Friday afternoon. Few actually do it, because the volume makes it tedious before it makes it insightful.
This is the exact gap Tagger was built for — an AI-proposed, fully editable codeframe across major languages, so your team reviews categories instead of inventing them row by row.
If you code open-ends in-house: what's your current turnaround from last verbatim to final codeframe?
Sources
#MarketResearch #DataAnalytics #SurveyDesign #QualitativeResearch